
 1800 066 846
Moving Data 2026: What 35,000 Dawson Moves Tell Us
What 35,000 Dawson moves tell us about where Australians move, and when. Since 2014 Dawson Moving & Storage has done over 35,000 household moves from our depots in Rowville (Melbourne) and Hume (Canberra), including over 13,000 interstate moves. This report shares the patterns in that data: the most popular interstate destinations, the busiest months to move, and the Melbourne suburbs we move most. Figures come from Dawson’s own job records, rounded down, and are updated each quarter. Last updated November 2026.
Key findings
- Queensland is the top destination for Victorians. Brisbane leads with over 670 households moved from Victoria since 2014, and the Sunshine Coast adds over 500 more.
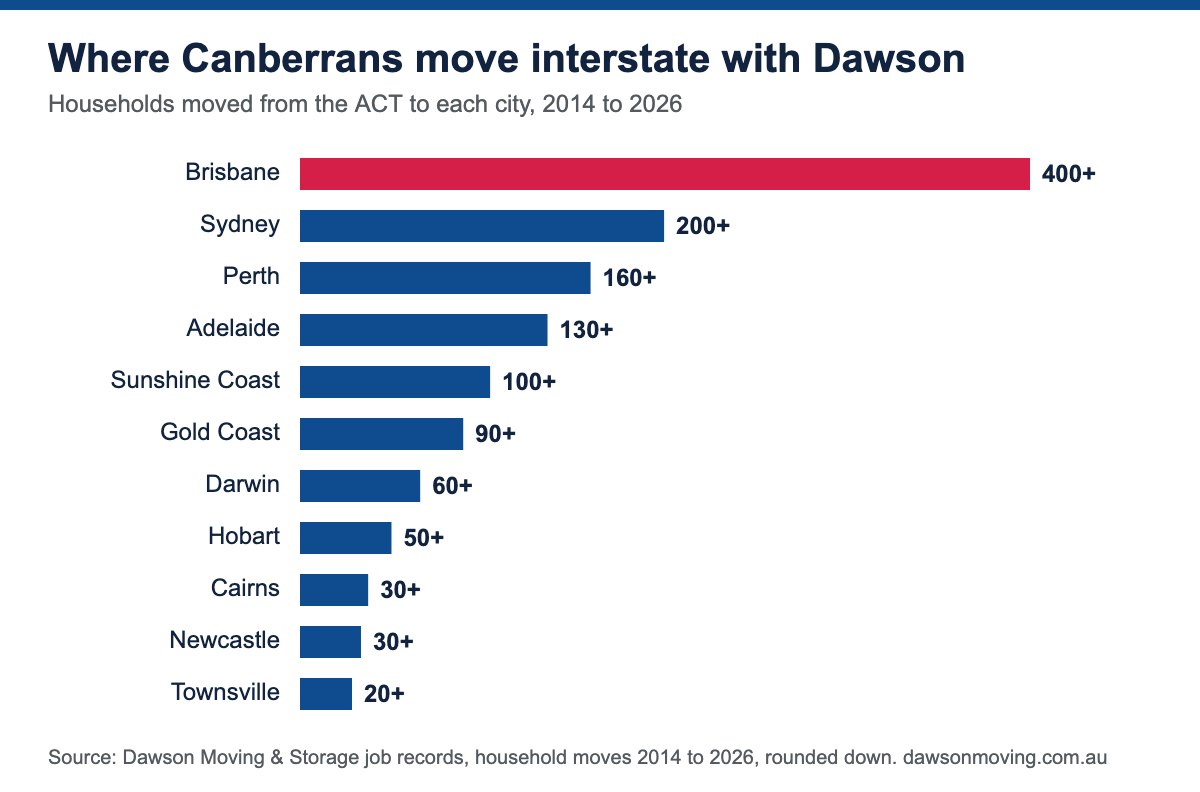
- Canberra to Melbourne is our busiest route out of the ACT, with over 950 moves since 2014.
- Summer is peak season. January is the busiest month for moves into Darwin, Cairns, Hobart, Launceston and the Sunshine Coast.
- Most Melbourne moves stay local. In suburbs like Glen Waverley, Wantirna South and Mount Waverley, over 70% of Dawson moves stay within Victoria.
Where Victorians and Canberrans move interstate
Households Dawson has moved into each city since 2014, and where they came from.
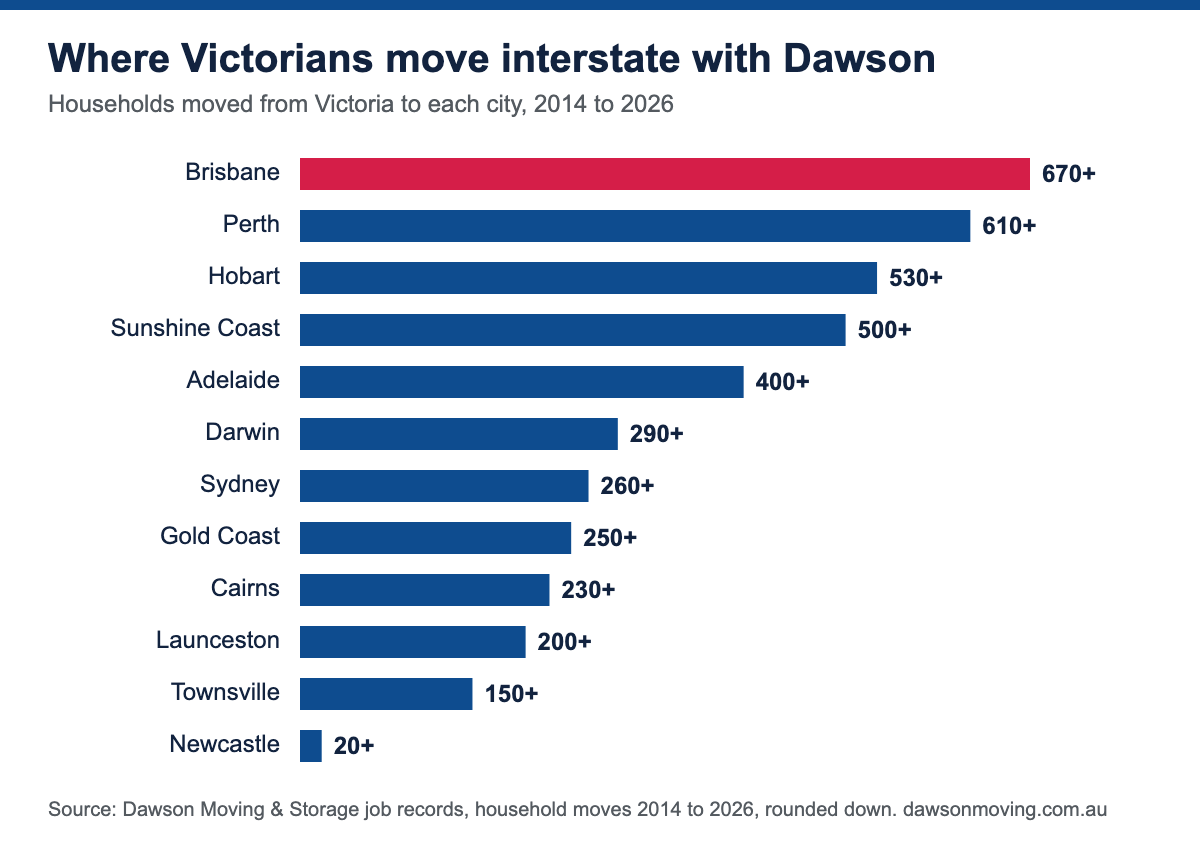
| City | Total moves in, since 2014 | From Victoria | From the ACT | Since 2023 |
|---|---|---|---|---|
| Brisbane | 1,100+ | 670+ | 400+ | 370+ |
| Perth | 820+ | 610+ | 160+ | 430+ |
| Sunshine Coast | 630+ | 500+ | 100+ | 280+ |
| Hobart | 610+ | 530+ | 50+ | 280+ |
| Adelaide | 580+ | 400+ | 130+ | 220+ |
| Sydney | 480+ | 260+ | 200+ | 160+ |
| Darwin | 390+ | 290+ | 60+ | 280+ |
| Gold Coast | 360+ | 250+ | 90+ | 90+ |
| Cairns | 270+ | 230+ | 30+ | 160+ |
| Launceston | 240+ | 200+ | 18 | 60+ |
| Townsville | 200+ | 150+ | 20+ | 90+ |
| Newcastle | 50+ | 20+ | 30+ | 8 |
Canberra to Melbourne (over 950 moves since 2014) isn’t shown here because this table covers moves into cities outside Victoria and the ACT. See our Canberra to Melbourne page.
The busiest and quietest months to move
When Dawson’s moves into each city happen. Busy months book out first, so plan ahead if you’re moving then.
| City | Busiest months | Quietest month |
|---|---|---|
| Brisbane | March (10%), January (10%) | April (7%) |
| Perth | July (11%), February (10%) | April (7%) |
| Sunshine Coast | January (11%), February (11%) | April (6%) |
| Hobart | January (11%), February (10%) | August (7%) |
| Adelaide | November (12%), October (11%) | May (5%) |
| Sydney | July (10%), September (10%) | March (6%) |
| Darwin | January (20%), July (10%) | May (4%) |
| Gold Coast | October (10%), January (10%) | May (7%) |
| Cairns | January (15%), September (13%) | December (4%) |
| Launceston | January (11%), February (11%) | October (6%) |
| Townsville | November (13%), December (12%) | March (5%) |
| Newcastle | July (13%), October (13%) | January (2%) |
Where people deliver to in each city
| City | Most common delivery suburbs |
|---|---|
| Brisbane | Brisbane city centre, North Lakes, Bulimba, West End and Coorparoo |
| Perth | Perth city centre, Canning Vale, Forrestfield, Baldivis and Scarborough |
| Sunshine Coast | Caloundra, Buderim, Maroochydore, Pelican Waters and Peregian Springs |
| Hobart | Hobart city centre, Sandy Bay, Glenorchy, Huntingfield and Kingston |
| Adelaide | Adelaide city centre, North Adelaide, Prospect, Glenelg and Norwood |
| Sydney | Sydney city centre, Lane Cove, Surry Hills, Randwick and Mosman |
| Darwin | Darwin city centre, Nightcliff, Rapid Creek and Stuart Park |
| Gold Coast | Robina, Upper Coomera, Helensvale and Surfers Paradise |
| Cairns | Cairns city centre, Kewarra Beach, Trinity Beach, Mareeba and Port Douglas |
| Launceston | Launceston city centre, Newstead, South Launceston, Kings Meadows and Trevallyn |
| Townsville | Townsville city centre, Burdell, North Ward, Kirwan and Idalia |
| Newcastle | Newcastle city centre, Merewether, Belmont North, Wallsend and Warners Bay |
Melbourne suburbs: who moves, and where to
Households Dawson has moved out of each suburb since 2014, the share that stayed in Victoria, and the most common interstate destinations.
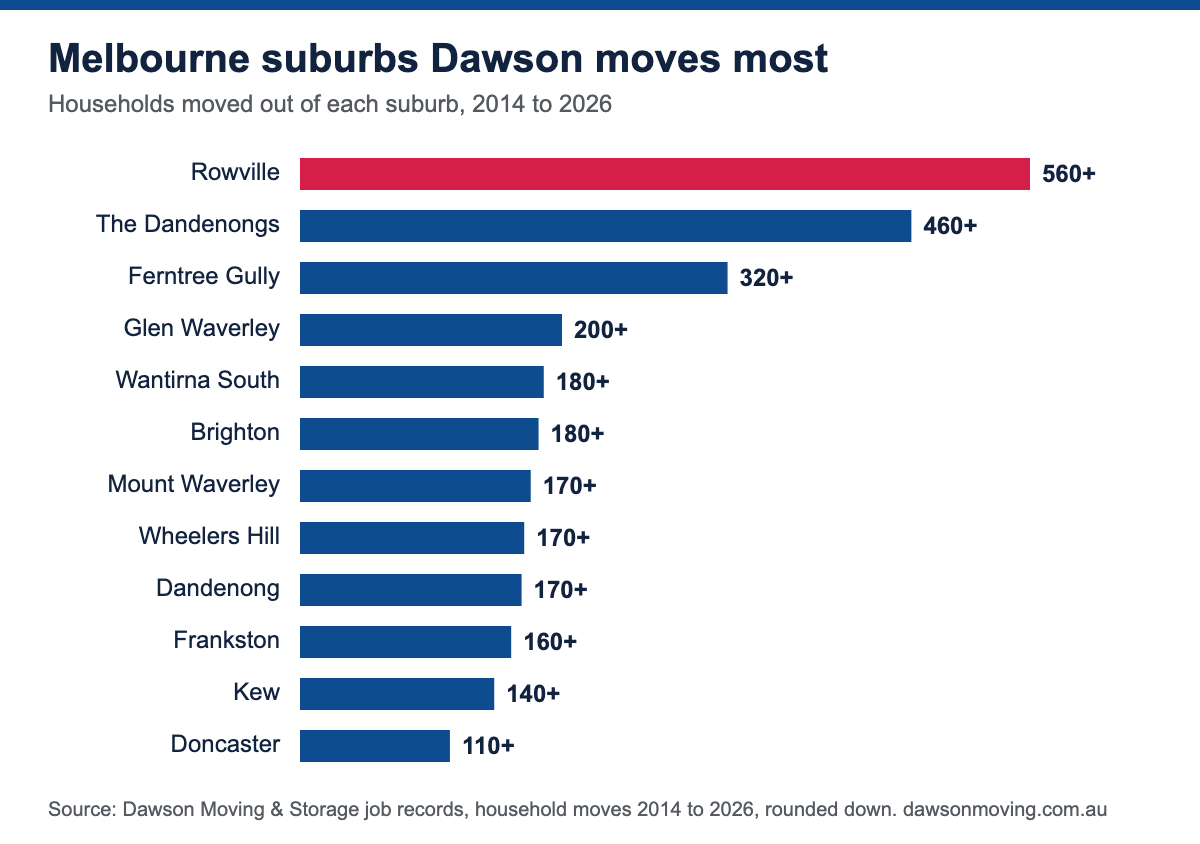
| Suburb | Moves out, since 2014 | Stayed in Victoria | Top interstate destinations | Busiest month |
|---|---|---|---|---|
| Rowville | 560+ | 72% | Queensland, Tasmania, New South Wales | June |
| the Dandenongs | 460+ | 84% | Queensland, New South Wales, the ACT | June |
| Ferntree Gully | 320+ | 83% | Queensland, the Northern Territory, New South Wales | August |
| Glen Waverley | 200+ | 84% | Queensland, the ACT, Western Australia | March |
| Wantirna South | 180+ | 86% | Queensland, Western Australia, Tasmania | February |
| Brighton | 180+ | 61% | Queensland, Tasmania, the ACT | September |
| Mount Waverley | 170+ | 84% | the ACT, Queensland, Tasmania | May |
| Wheelers Hill | 170+ | 85% | Queensland, New South Wales, the ACT | April |
| Dandenong | 170+ | 33% | the ACT, Tasmania, Queensland | February |
| Frankston | 160+ | 51% | Queensland, Tasmania, Western Australia | October |
| Kew | 140+ | 65% | the ACT, Tasmania, Queensland | July |
| Doncaster | 110+ | 65% | Queensland, the ACT, New South Wales | February |
| Balwyn | 100+ | 66% | Queensland, the ACT, South Australia | May |
| Malvern | 100+ | 56% | the ACT, Queensland, New South Wales | January |
| Toorak | 100+ | 66% | the ACT, New South Wales, Queensland | August |
| Wantirna | 90+ | 86% | Queensland, the ACT, Western Australia | March |
| Camberwell | 90+ | 59% | the ACT, Queensland, New South Wales | January |
| Mornington | 90+ | 64% | Queensland, Tasmania, New South Wales | July |
| Vermont South | 60+ | 84% | Queensland, New South Wales, the ACT | May |
| Armadale | 60+ | 43% | Tasmania, New South Wales, Queensland | February |
| Point Cook | 50+ | 17% | Queensland, Tasmania, the ACT | December |
| Templestowe | 50+ | 50% | the ACT, Queensland, Tasmania | September |
| Vermont | 50+ | 83% | the ACT, Queensland, New South Wales | May |
| Werribee | 40+ | 13% | Tasmania, Queensland, the ACT | October |
| Melton | 15 | 23% | Queensland, New South Wales, the ACT | March |
What this means if you’re moving
- Moving in summer? December and January are peak season and cost more, so book early. Our 2026 price guide shows prices by home size and route.
- Heading to Queensland? You’re in good company. See Melbourne to Brisbane, Sunshine Coast and Canberra to Brisbane.
- Need time between homes? We can store your furniture at Rowville or Hume and deliver when you’re ready.
Moving data questions
Where do Victorians move interstate most?
Brisbane. Since 2014 Dawson has moved over 670 households from Victoria to Brisbane, followed by Perth (over 610), Hobart (over 530) and the Sunshine Coast (over 500). Queensland as a whole is the most common destination for Dawson’s Melbourne customers.
Where do Canberrans move interstate most?
Melbourne is Dawson’s busiest route out of Canberra, with over 950 moves since 2014. After Melbourne, the most common destinations from the ACT are Brisbane (over 400 households since 2014), Sydney (over 200) and Perth (over 160).
What is the busiest month to move interstate?
It depends on the destination. January is the busiest month for Dawson moves into Darwin (20% of jobs), Cairns (15%) and Hobart (11%), while July is busiest for Sydney and Perth, and November for Adelaide and Townsville. Book early for summer, when December and January demand peaks.
Which Melbourne suburbs does Dawson move most?
Rowville, where our depot is, tops the list with over 560 households moved out since 2014, followed by the Dandenong Ranges (over 460), Ferntree Gully (over 320), Glen Waverley (over 200) and Wantirna South (over 180).
How many moves has Dawson done?
Since 2014 Dawson Moving & Storage has done over 35,000 household moves from Rowville in Melbourne and Hume in Canberra, over 11,000 of them since 2023, including over 13,000 interstate moves. Dawson is family-owned and has been moving people since 1927.
Where does this data come from?
Dawson Moving & Storage’s own job records for household moves from 2014 to 2026. Figures are rounded down and updated each quarter.
Source: Dawson Moving & Storage job records, household moves 2014 to 2026, rounded down. You’re welcome to quote these figures with a link to this page. Dawson Moving & Storage is family owned since 1927 and AFRA accredited. Not affiliated with Dawson Moving and Storage NSW or Dawson Moving & Storage NQ (Townsville). See also Dawson moving facts.
Call our Friendly Team
of Removalists on
- Call us | 1800 066 846
INTERSTATE
REMOVALISTS
CLIENT
TESTIMONIALS
-
We were very happy with the 3 guys who we had who went out of their way to may the day run as smoothly as possible. Would definitely use you guys again!
Sam & Tracey
-
Thankyou to Dawsons for making our move from Melbourne to Leeton a very smooth move. Thanks to the drivers and workers all did a fantastic job thankyou.
Faye
-
I just want to thank you for your moving of my furniture on Tuesday. The chaps were so helpful and did a great job.
Jan


